The question
The larger embedding model asks for more memory and compute. This paired bilingual retrieval experiment checked whether the extra cost bought a detectable quality improvement on the actual evaluation set.
From the original notebook
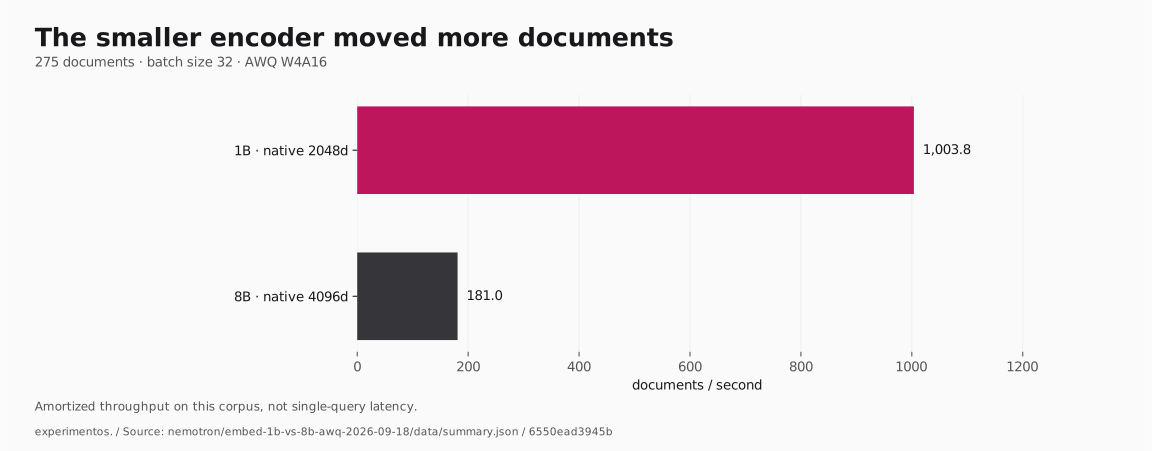
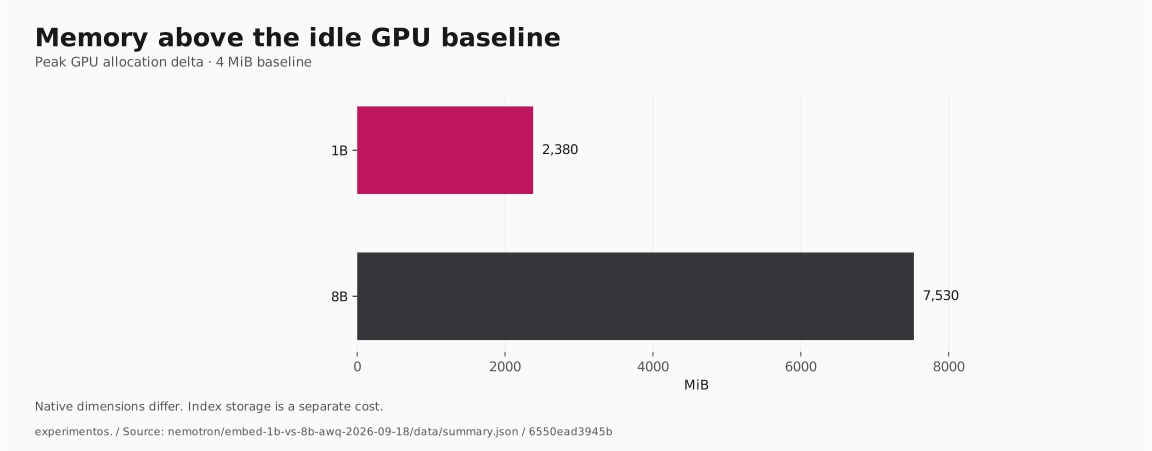
On a 110-query English/Spanish memory-retrieval bench over 275 passages, the 8B AWQ encoder showed no statistically established quality lead over the 1B (both paired-bootstrap 95% CIs cross zero), while the 1B embedded the corpus 5.5x faster (1,003.8 vs 181.0 docs/s on RTX 3090) at ~3.2x less VRAM (2.32 vs 7.35 GiB peak delta).
Executive summary
- Measured: Hit@1 of 91.82% (1B, native 2048D), 92.73% (8B, native 4096D), and 94.55% (8B truncated to 2048D) with exact dot-product ranking; all variants reach 100% Hit@5.
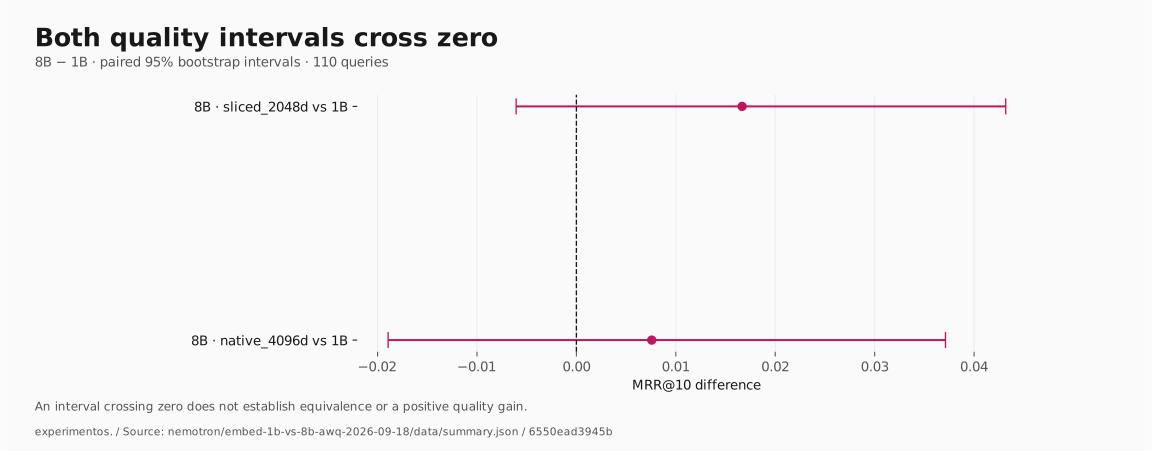
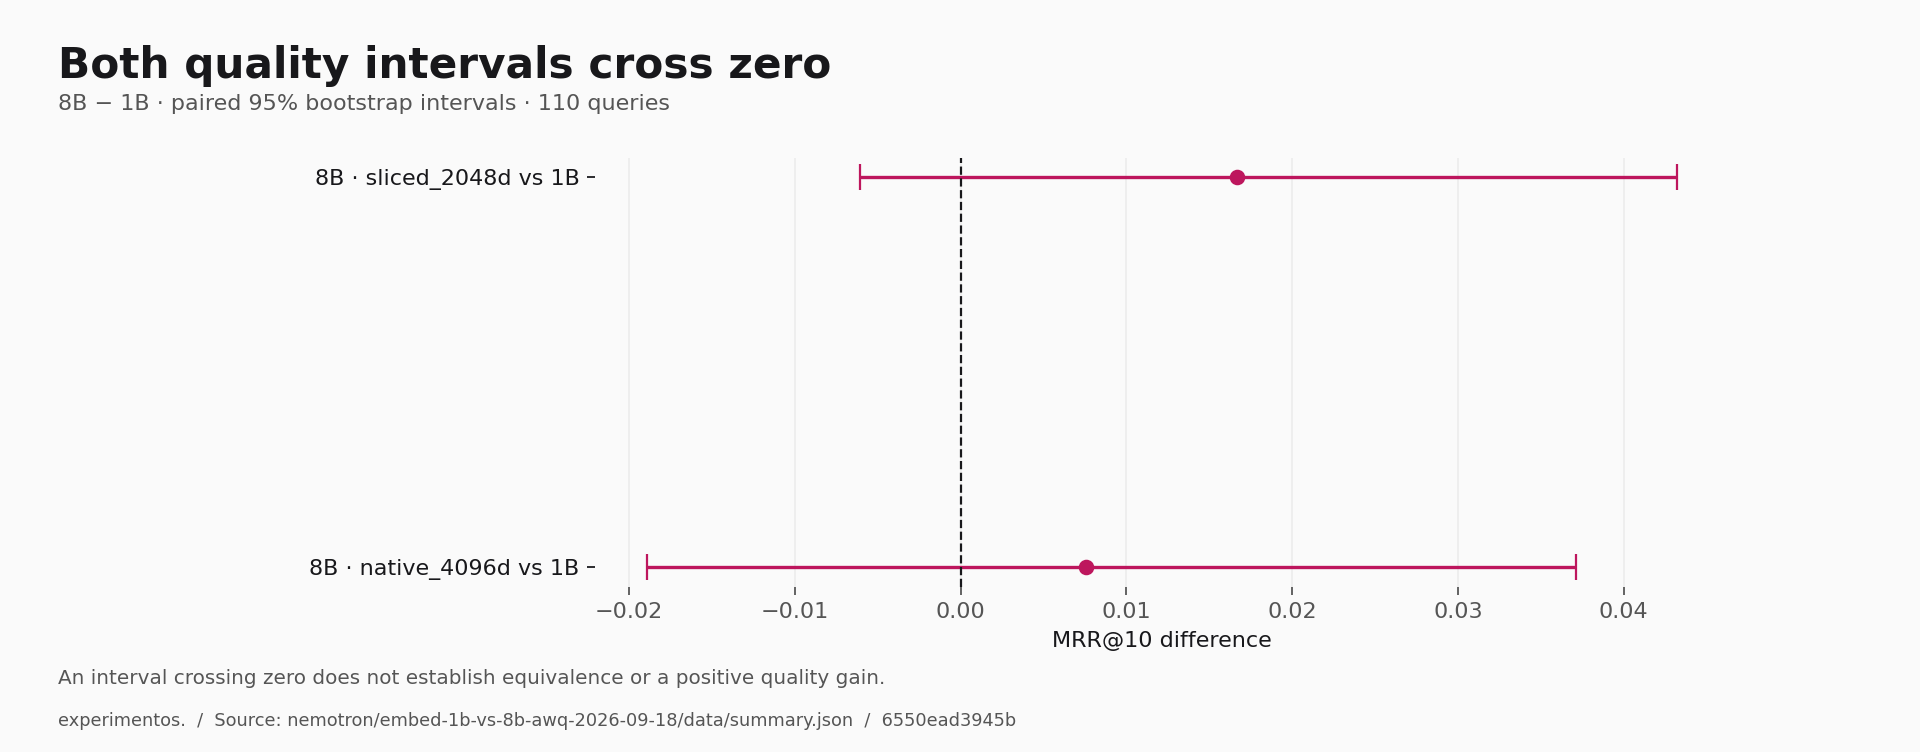
- Measured: the 8B’s paired deltas are not significant at n=110 — ΔMRR@10 +0.017 [−0.006, +0.043] for the storage-matched slice, +0.008 [−0.019, +0.037] for native 4096D (5,000-sample bootstrap, 95% CI).
- Measured: the 1B embeds 5.5x faster, needs ~3.2x less GPU memory, and halves index storage at native dimensions (7.63 vs 15.26 GiB per 1M float32 vectors).
- Recommended (documented operational judgment, not a measurement): deploy the 1B AWQ at native 2048D; revisit only if real-traffic evaluation shows Hit@1 gaps the 8B demonstrably closes.
- Principal caveat: the dataset is synthetic and easy (100% Hit@5 everywhere), so this bounds the 8B’s advantage on this workload — it does not prove the 8B cannot win on harder data.
The problem (why)
MemPalace is a bilingual (EN/ES) long-term-memory retrieval service: short memory passages are embedded once at write time, user queries at read time, and cosine similarity returns the most relevant memories. The operational question: which AWQ-quantized Nemotron-3 embedding model to pin as the encoder? The 8B costs more in three currencies that matter daily: embedding throughput, VRAM (it shares GPUs with other services), and vector storage at its native 4096D.
The subtlety: the 8B outputs 4096D vectors, the 1B 2048D. If the 8B scores higher, is it a better encoder or just twice the dimensions — and would it still win truncated to 2048D, at exactly the 1B’s storage cost? The experiment separates those questions.
The system and experiment (what)
- Models (both AWQ W4A16, served by vLLM 0.25.0):
groxaxo/Nemotron-3-Embed-1B-AWQ-W4A16(1.04 GB safetensors, GPU 0) andgroxaxo/Nemotron-3-Embed-8B-AWQ-W4A16-G32-ASYM(5.36 GB, GPU 1). - Hardware: Ubuntu 24.04.5 LTS workstation, 3x RTX 3090 24 GB (driver 595.58.03), 20 CPUs, 128 GB RAM; one dedicated GPU per model process.
- Workload: 275 passages in 55 hand-written topic clusters — per cluster, 1 gold passage, 2 hard negatives (same topic, different key fact), 2 fillers — queried by 110 labeled queries (typically one English, one Spanish per cluster) tagged temporal, paraphrase, vague-reference, and cross-lingual.
- Variables tested: exactly one — the encoder variant, scored on identical inputs: 1B native 2048D, 8B native 4096D, and the same 8B embeddings truncated to the first 2048 dimensions and re-L2-normalized (the “storage-matched slice”).
- Software pins: vLLM 0.25.0, Python 3.12.14, transformers 5.12.1, torch 2.11+cu130, numpy 2.3.5, scipy 1.18.1 (
scripts/environment.yml).
Method (how)
scripts/build_dataset.py generates and gates the corpus/queries before anything is embedded: no duplicate query groups, no lexical-leakage flags (query/passage pairs with token Jaccard ≥ 0.65 would be flagged). The committed dataset passed with zero warnings (data/dataset_validation.json).
scripts/compare_nemotron_mempalace.py runs both models in parallel, one process per GPU, configured identically: vLLM pooling runner, bfloat16, max_model_len=4096, gpu_memory_utilization=0.90, batch size 32. The query: / passage: prefixes the Nemotron format requires are applied manually and identically to both models, and a two-prompt warm-up is excluded from throughput timing.
flowchart LR
    A[build_dataset.py\n55 clusters] --> B{Validation gates\nduplicates / Jaccard >= 0.65}
    B -- zero flags --> C[1B worker GPU 0]
    B -- zero flags --> D[8B worker GPU 1]
    C --> E[query:/passage: prefixes\nbatch 32, bf16 pooling]
    D --> E
    E --> F[L2 normalize\nfinite + unit-norm check]
    F --> G[Exact dot-product ranking\n275 passages]
    G --> H[Per-variant metrics\nHit@k, MRR@10, nDCG@10]
    G --> I[8B slice to 2048D\n+ renorm, same embeddings]
    H --> J[Paired bootstrap\n5000 samples, seed 1337]
    I --> J
    J --> K[summary.json / REPORT.md\n+ failure_examples.json]
Figure 4 — Measurement path. Every number in this post comes from this pipeline; all validation gates (duplicate check, lexical-leakage check, embedding finite/unit-norm checks) passed before ranking was scored. Notice that the 8B’s two variants share one embedding pass — slicing happens afterwards in NumPy, adding no inference cost. This diagram cannot establish statistical significance; that comes from the bootstrap below.
Timing is wall-clock per embedding pass (items_per_second = n / wall_seconds), with per-batch p50/p95 latencies recorded separately. VRAM is a peak-delta: a background thread polls nvidia-smi every 100 ms and reports peak minus pre-launch baseline, covering the whole process lifetime — model load through CUDA-graph capture through embedding — not just steady-state inference. Index storage is arithmetic: GiB per 1M float32 vectors = dim × 4 bytes × 10⁶ / 2³⁰. Significance uses a paired bootstrap (5,000 resamples over the same 110 queries, seed 1337).
Results
Quality first; the decision metric is Hit@1 (gold passage ranked first), with MRR@10 rewarding near-misses:
| Variant | Dim | Hit@1 | Hit@3 | MRR@10 | nDCG@10 | Hard-neg win |
|---|---|---|---|---|---|---|
| 1B native | 2048 | 91.82% | 98.18% | 0.9545 | 0.9662 | 94.55% |
| 8B native | 4096 | 92.73% | 100% | 0.9621 | 0.9720 | 94.55% |
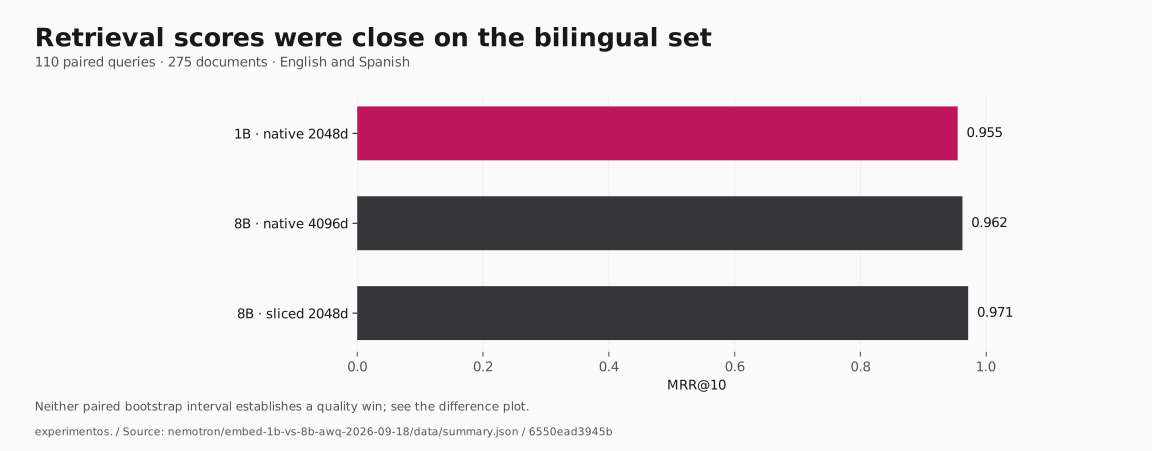
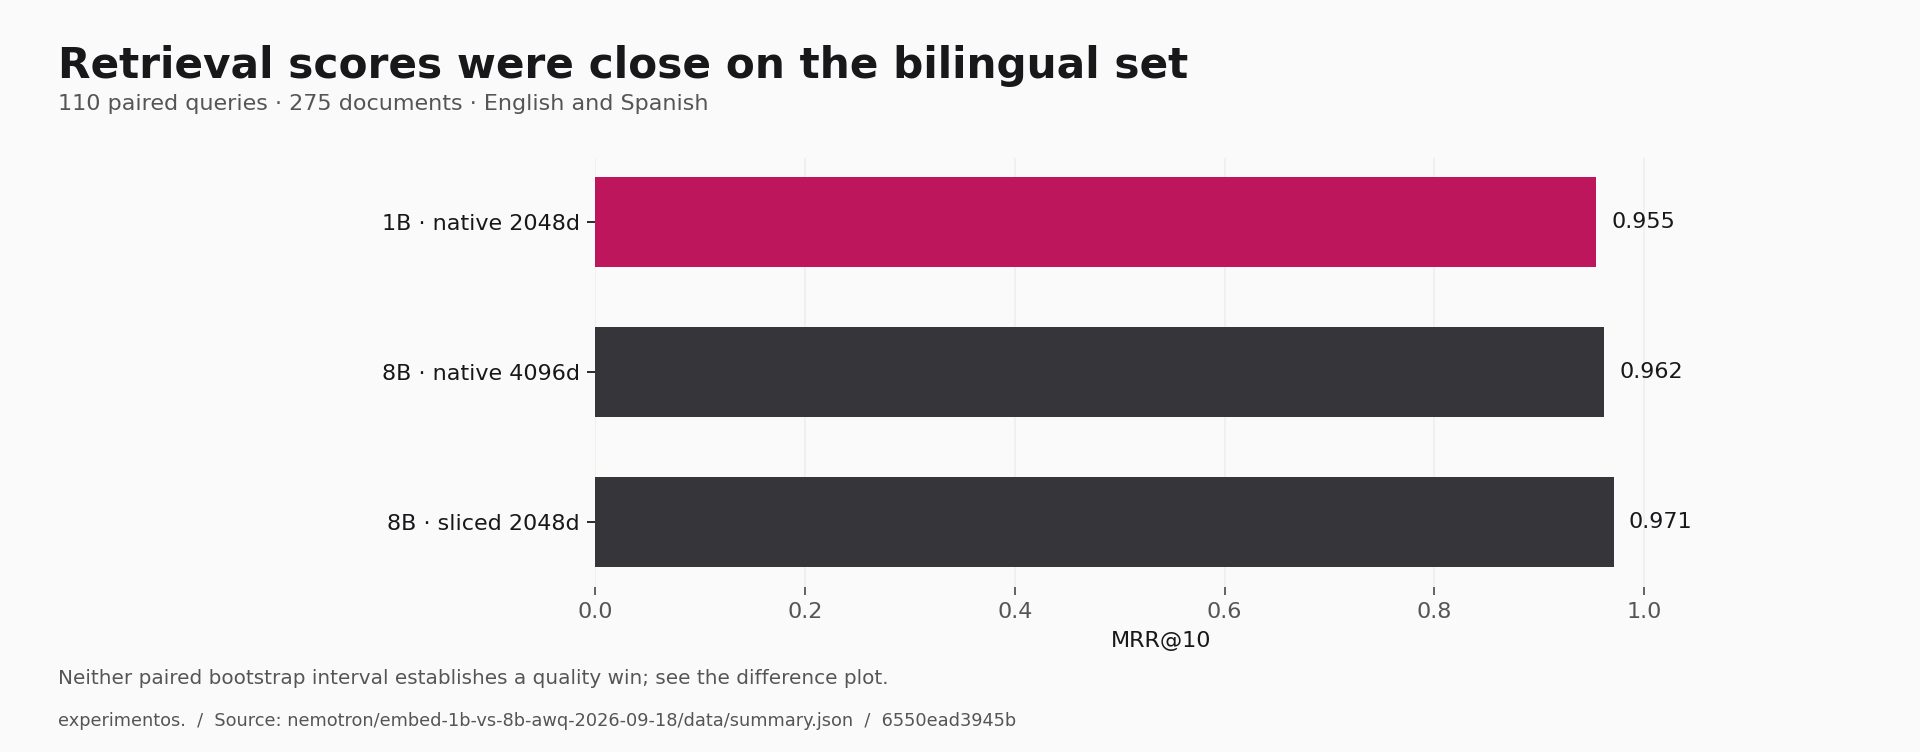
| 8B sliced+renorm | 2048 | 94.55% | 100% | 0.9712 | 0.9787 | 96.36% |
All variants: 100% Hit@5/10/20, median first-relevant rank 1.0. n=110 queries per cell, aggregate = mean over per-query scores.
Paired bootstrap (A − B, 5,000 samples, 95% CI):
| Comparison | ΔHit@1 [CI] | ΔMRR@10 [CI] | P(Δ>0) MRR | Rank wins/ties/losses (A) |
|---|---|---|---|---|
| 8B sliced-2048D vs 1B native | +0.0273 [−0.0091, +0.0727] | +0.0167 [−0.0061, +0.0432] | 91.7% | 4 / 104 / 2 |
| 8B native-4096D vs 1B native | +0.0091 [−0.0364, +0.0545] | +0.0076 [−0.0189, +0.0371] | 68.9% | 4 / 102 / 4 |
Both CIs cross zero: the benchmark did not establish a quality win for the 8B in either configuration. The storage-matched slice leans 8B (91.7% bootstrap probability of a positive MRR delta) — a hint, not a proof; of 110 queries, the slice changes the first-relevant rank on only 6 (4 wins, 2 losses).
Now cost, where the models do separate decisively:
| Model | Docs/s | Queries/s | Batch p50 (docs) | Peak ΔVRAM | Index / 1M f32 |
|---|---|---|---|---|---|
| 1B-AWQ | 1,003.8 | 1,254.9 | 29.2 ms | 2.32 GiB | 7.63 GiB |
| 8B-AWQ | 181.0 | 239.9 | 168.8 ms | 7.35 GiB | 15.26 GiB |
Derived ratios: throughput 1003.8 / 181.0 = 5.5x; VRAM 7.35 / 2.32 = 3.2x; index at native dims 4096 / 2048 = 2.0x. The largest relative quality delta observed, sliced-8B vs 1B MRR, is (0.9712 − 0.9545) / 0.9545 ≈ +1.7% — inside its own CI width. Model load took 88.1 s (1B) and 122.3 s (8B), including first-run weight downloads of 46.2 s and 69.5 s.
Figures
Figure 1 — Top-1 accuracy by variant. Measured on the full 110-query bench, exact dot-product over the same 275-passage corpus; differences shown are not statistically significant at n=110.
variant,hit1_pct
1B native 2048D,91.82
8B native 4096D,92.73
8B sliced 2048D,94.55
Chart spec: horizontal bars, one per variant, x-axis 88–96%, exact value labeled at each bar end. Source: data/summary.json → models.{1b,8b}.variants.*.hit@1. Alt text: three bars of nearly equal length; the 8B sliced to 2048D is highest at 94.55%, the 1B lowest at 91.82%, the 8B native in between at 92.73%. Notice how compressed the quality spread is — under 3 points separate best from worst. This figure cannot establish that the ordering would survive on harder data or that the gaps are significant (see bootstrap table).
Figure 2 — Embedding throughput per model. Wall-clock items/second, batch 32, single RTX 3090 per model, warm-up excluded; the 8B’s sliced variant shares the 8B bar because truncation is post-hoc NumPy work.
model,docs_per_s,queries_per_s
1B-AWQ,1003.75,1254.93
8B-AWQ,180.96,239.90
Chart spec: two panels sharing units (items/second), two bars each, exact values labeled. Source: data/summary.json → models.*.performance.{documents,queries}.items_per_second. Alt text: in both panels the 1B bar is about five and a half times longer than the 8B bar (1,003.8 vs 181.0 docs/s; 1,254.9 vs 239.9 queries/s). Notice this is the widest measured gap in the whole experiment. This figure cannot establish absolute production throughput — numbers are specific to this GPU, batch size, and sequence lengths.
Figure 3 — Per-model cost: GPU memory and index size. Left panel is the measured peak VRAM delta (100 ms nvidia-smi polling, process lifetime); right panel is arithmetic storage at native dimensions for 1M float32 vectors.
model,peak_vram_delta_gib,index_gib_per_million_f32
1B-AWQ,2.32,7.63
8B-AWQ,7.35,15.26
Chart spec: two panels, units GiB in both, exact values labeled. Source: data/summary.json → models.*.performance.vram.peak_delta_mib (÷1024) and index_float32_gib_per_million_native. Alt text: the 8B bars are roughly three times longer for VRAM (7.35 vs 2.32 GiB) and exactly two times longer for index storage (15.26 vs 7.63 GiB). Notice the 8B’s sliced variant would erase the storage gap but not the VRAM or throughput gaps. This figure cannot establish total cost of ownership — it omits CPU RAM, disk for weights, and embedding-time energy.
Why the result looks this way
Directly observed: every variant retrieves the gold passage within the top 5 for all 110 queries. On a bench where both models are near ceiling, the 8B has almost no room to demonstrate superiority — 104 of 110 sliced-vs-1B comparisons are exact rank ties. The strongest disagreements are instructive: for “Why can’t all four GPUs train at the same time?” (EN) / “¿Por qué no pueden entrenar las cuatro GPUs a la vez?” (ES), the 8B slice ranks the gold first while the 1B ranks it fourth — the kind of same-topic hard-negative confusion the 8B resolves slightly more often.
Plausible interpretation (hypothesis, not measurement): the 8B’s own 4096D output scored below its 2048D truncation (MRR@10 0.9621 vs 0.9712), suggesting the trailing dimensions add noise rather than signal for 1–2-sentence memory passages; confirming that needs a harder dataset and a dimension ablation.
The tag slices in README.md (recomputable from the per-query rows in data/1b_result.json / data/8b_result.json) agree: technical (n=73) and paraphrase (n=59) cells favor the slice modestly, while temporal (n=10) and vague-reference (n=3) cells are anecdotes — the 8B native’s temporal dip to 0.8500 MRR rests on 10 queries.
Operational recommendation
The documented choice for MemPalace is the 1B AWQ at native 2048D, with query: /passage: prefixes and L2-normalized cosine retrieval. The trade-off, plainly: you give up a possible-but-unproven ~1–3 point Hit@1 improvement (the 92%-probability slice lean) and buy 5.5x embedding throughput, ~3.2x lower VRAM, and half the index storage. If you want storage parity and can afford the inference cost, the sliced-2048D configuration is the only 8B variant that matched 1B storage while topping every quality metric in this run — but treat its +2.7-point Hit@1 edge as unresolved until a harder bench replicates it.
Safe rollout check: embed a fixed probe set (the committed data/mempalace_queries.jsonl works), assert Hit@5 = 100% and median rank = 1 before swapping encoders, and re-run the paired bootstrap on your own traffic before believing any delta.
Limits and next experiment (what this does not prove)
- Synthetic, easy data: hand-written clusters, not real MemPalace traffic; 100% Hit@5 leaves no headroom, so “no 8B win” means “no win detectable here”, not “no win exists”; absolute scores do not transfer.
- n=110: powered for large effects only; the small observed deltas are correctly reported as inconclusive.
- Short passages: 1–2 sentences; long-document retrieval untested.
- Single run per model: no seed or infrastructure variance measured; determinism comes from exact retrieval plus fixed tie-breaks, not repetition.
- Config-specific throughput: RTX 3090, batch 32,
gpu_memory_utilization=0.90,max_model_len=4096, bf16 pooling — apples-to-apples between models, not universal absolutes.
Smallest controlled follow-up testing the strongest remaining claim (“the 8B slice is genuinely better at matched storage”): keep the harness, prefixes, and seed identical; swap in harder labeled data — real MemPalace queries plus near-duplicate memories, sized so Hit@5 lands below 100% — and re-run the 5,000-resample paired bootstrap.
How to reproduce or audit
Portable checks (any machine with the committed repo):
conda env create -f scripts/environment.yml
bash scripts/run_parallel.sh 0 1   # 1B on GPU 0, 8B on GPU 1
Needs ~7 GB free for the model downloads plus the environment, and 2 free GPUs (or pass the same GPU index twice / use --sequential for one card); the run regenerates summary.json, REPORT.md, and the per-variant JSONs. To audit without GPUs: every number above is recomputable from data/summary.json and data/paired_comparisons.json; tag slices and rank win/tie/loss counts recompute from the per_query arrays in data/1b_result.json and data/8b_result.json (done as a cross-check while writing — they match README.md exactly). Source-workstation-only: the VRAM and throughput numbers themselves, which depend on this exact GPU, driver, and machine state.
Two environment hazards: pip install "vllm==0.25.0" numpy is not sufficient — the import chain also needs scipy, threadpoolctl, and msgpack, all pinned in environment.yml; and transformers 5.17.0 (latest at run time) breaks from vllm import LLM with a masked GenerationMixin error, while 5.12.1 works. vLLM’s lazy imports mean import vllm; vllm.__version__ succeeding proves nothing — verify with from vllm import LLM.
Evidence appendix
README.md— experiment entry point: setup, headline tables, tag slices, environment notes, limits;FINDINGS.md— plain-language winner, caveats, deployed configuration.data/REPORT.md— generated metric tables and bootstrap CIs;data/summary.json— machine-readable source of every quality/throughput/VRAM/index number quoted here.data/1b_result.json,data/8b_result.json— per-variant aggregates, per-query ranks, tag breakdowns, timing and norm statistics.data/paired_comparisons.json— bootstrap deltas, CIs, probabilities, rank win/tie/loss counts;data/failure_examples.json— top-5 retrievals for the 15 strongest disagreements per direction.data/dataset_validation.json— duplicate and lexical-leakage gates (zero flags);data/mempalace_corpus.jsonl(275 rows) anddata/mempalace_queries.jsonl(110 rows) — the labeled bench.scripts/compare_nemotron_mempalace.py— benchmark harness;scripts/build_dataset.py— dataset generator and validation gates;scripts/environment.ymlandscripts/run_parallel.sh— pinned environment and one-command rerun. Figures 1–3 were computed by script directly fromdata/summary.json; no values were hand-entered.
Glossary: AWQ W4A16 — 4-bit weight-only quantization, 16-bit activations; Hit@k / MRR@10 — gold in top k / mean reciprocal rank of first gold within 10; hard negative — same-topic passage with a different key fact; paired bootstrap — significance test resampling matched per-query outcomes; peak ΔVRAM — process-lifetime GPU memory above pre-launch baseline; sliced variant — first 2048 dimensions of the 8B’s 4096D embeddings, re-L2-normalized.
EDITORIAL NOTES
- Omitted — raw corpus/query text beyond two quoted examples: the full dataset is committed and linked; the post quotes only the q081/q082 disagreement pair, since wholesale quoting adds length without evidence.
- Omitted — worker logs (
data/1B-AWQ.worker.log,data/8B-AWQ.worker.log): used only to source the first-run download times (46.2 s / 69.5 s); not summarized further because they contain workstation-local cache paths with no public value. - Omitted — full tag-slice table: replaced by a prose summary plus the recomputation note; small cells (temporal n=10, vague-reference n=3) are labeled anecdotes, and the full table remains in
README.md. - Omitted — throughput-vs-quality scatter plot: with only two models (plus a derived slice sharing the 8B’s throughput), two points cannot support a fitted relationship; bar panels carry the information honestly.
- Ambiguity disclosed — “~3x less VRAM”:
FINDINGS.mdsays ~3x while the raw data gives 7.35/2.32 = 3.16x; this post uses the computed 3.2x fromsummary.jsonper the raw-data-priority rule. - Charts: rendered as PNGs generated from
data/summary.json; the CSV blocks and chart specifications above each image allow exact regeneration on any platform.
Keep exploring
- FINDINGS.md — embed-1b-vs-8b-awq-2026-09-18
- README.md — embed-1b-vs-8b-awq-2026-09-18
- REPORT.md — data
Original experiment record. Workstation paths have been generalized. Detailed measurements below retain their original workload and validation boundaries.